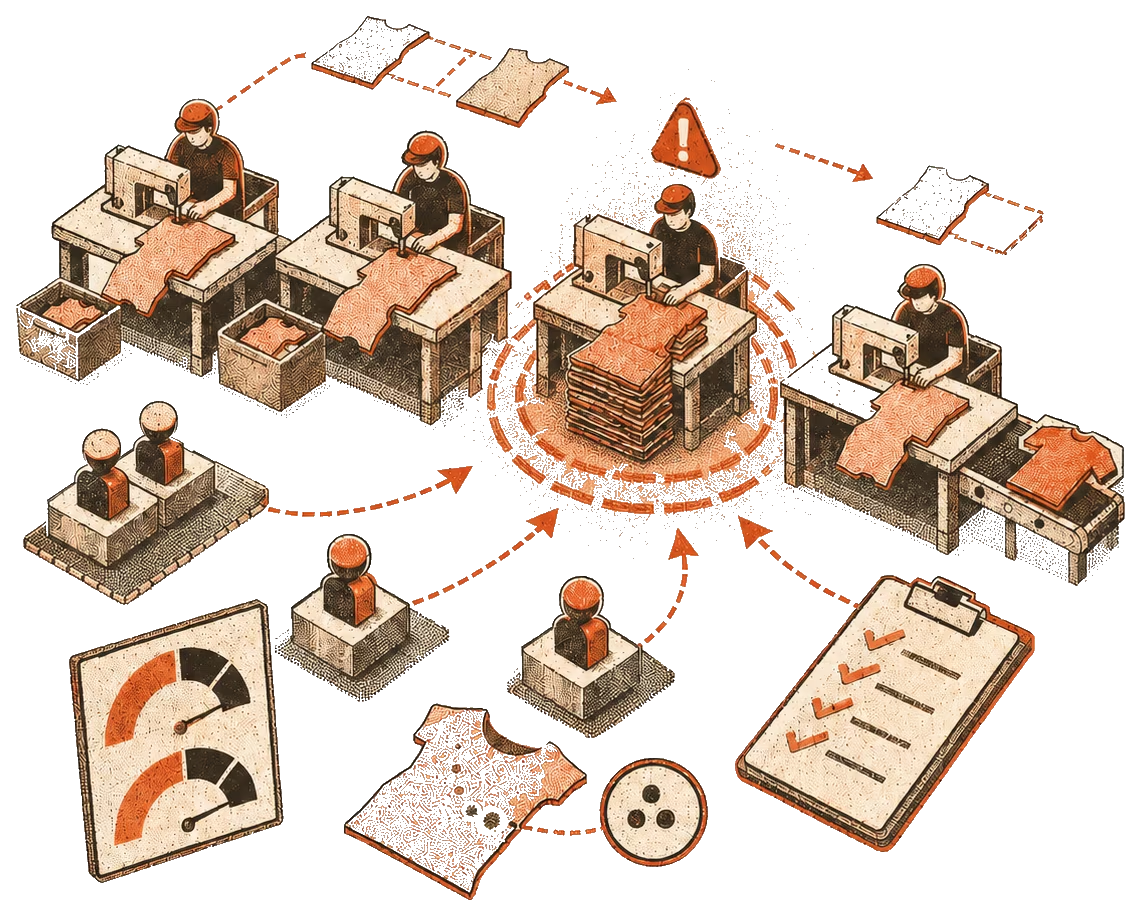
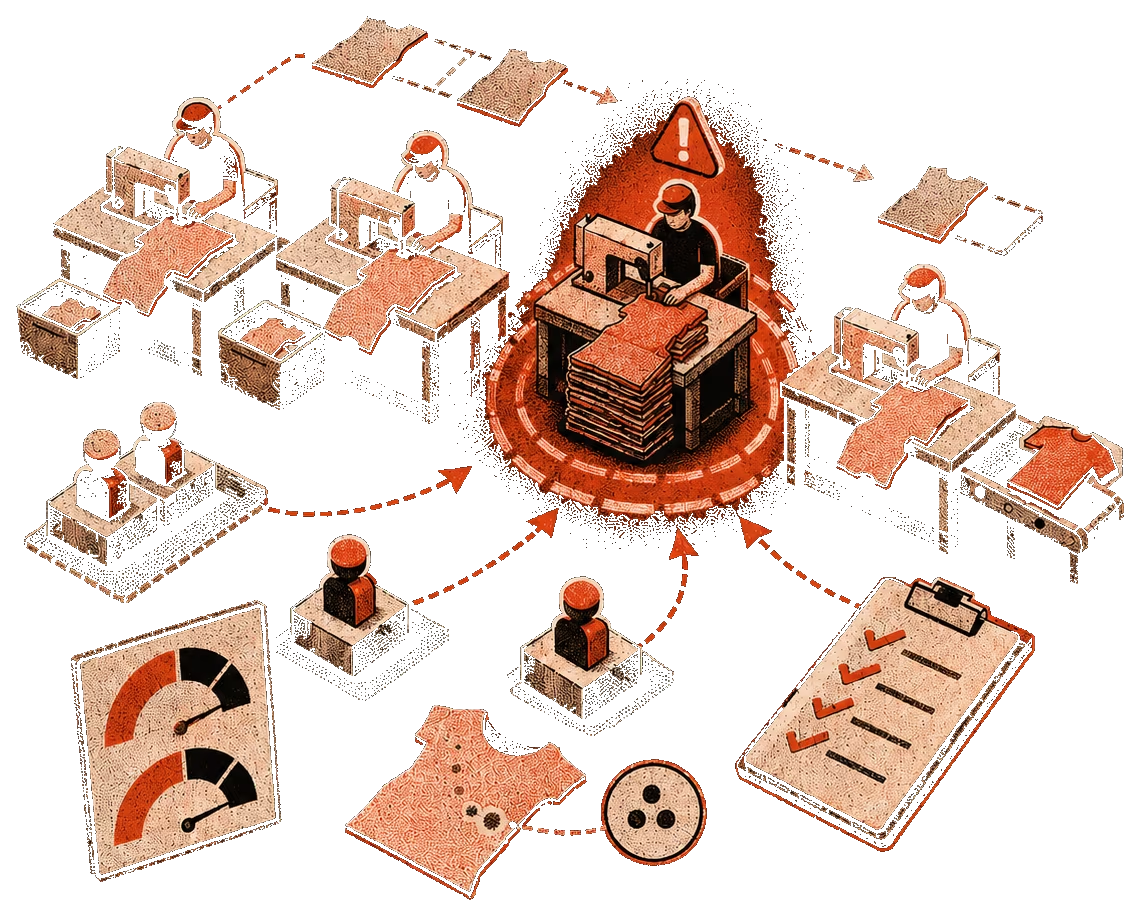
ProTrac tracks garment production on the floor of an RMG factory, during the shift, while the shift can still be changed.
The shift is the deadline
A daily production report is an autopsy. By the time it shows that a line ran behind, the hours are spent and the only decision left is who to blame for them.
That is the constraint the whole system is built around. Not "give managers better analytics" but "put the signal in front of a supervisor early enough that the shift is still recoverable." The size of that window decides everything else.
The floor as data
The model is lines, processes, orders and the plan each is working against. Actual output is compared to plan continuously instead of reconciled at the end of the day, so drift surfaces as it forms: a process falling behind, a defect rate climbing, a choke point building at one station.
DHU (defects per hundred units) and plan-versus-actual are the two signals that change behavior, and both are only useful attached to a place. A number on a dashboard is trivia. The same number tied to a specific line and process, right now, is an instruction.
Redis-backed updates keep the shared view current enough that supervisors trust it mid-shift, which is the only kind of trust worth having here. Screens were designed to point at the next action rather than to display totals.
The scan
Floor data arrives by scan: bundles issued, assembly tracked, sewing QC, finishing QC. Each scan is an event with a place and a time, which is what makes live comparison possible at all. It also puts the correctness rules where the work happens, with sequencing and FIFO enforced at the point of scan instead of caught later in a report.
The code
Both halves are public. The repositories carry the system’s internal name, Protraq:
- protrac-backend: the system of record. Orders, styles, bundles, spreads, lines, scan flows, reporting endpoints.
- protrac-frontend: the operator-facing app. Management screens, scan flows, kiosk reporting views for the sewing floor.